Active Watchlist
SRTA
Strata Critical Medical, Inc.
90score
Focused post-Blade medical infrastructure platform for organ-transplant logistics, surgical recovery, organ placement, NRP/perfusion, staffing, and equipment. The market may still price SRTA as legacy passenger/eVTOL-adjacent aviation or low-margin logistics, while the upside case is a one-call mission-critical transplant infrastructure consolidator with network-density advantages, clinical-service optionality, improving cash conversion, and bolt-on M&A evidence.
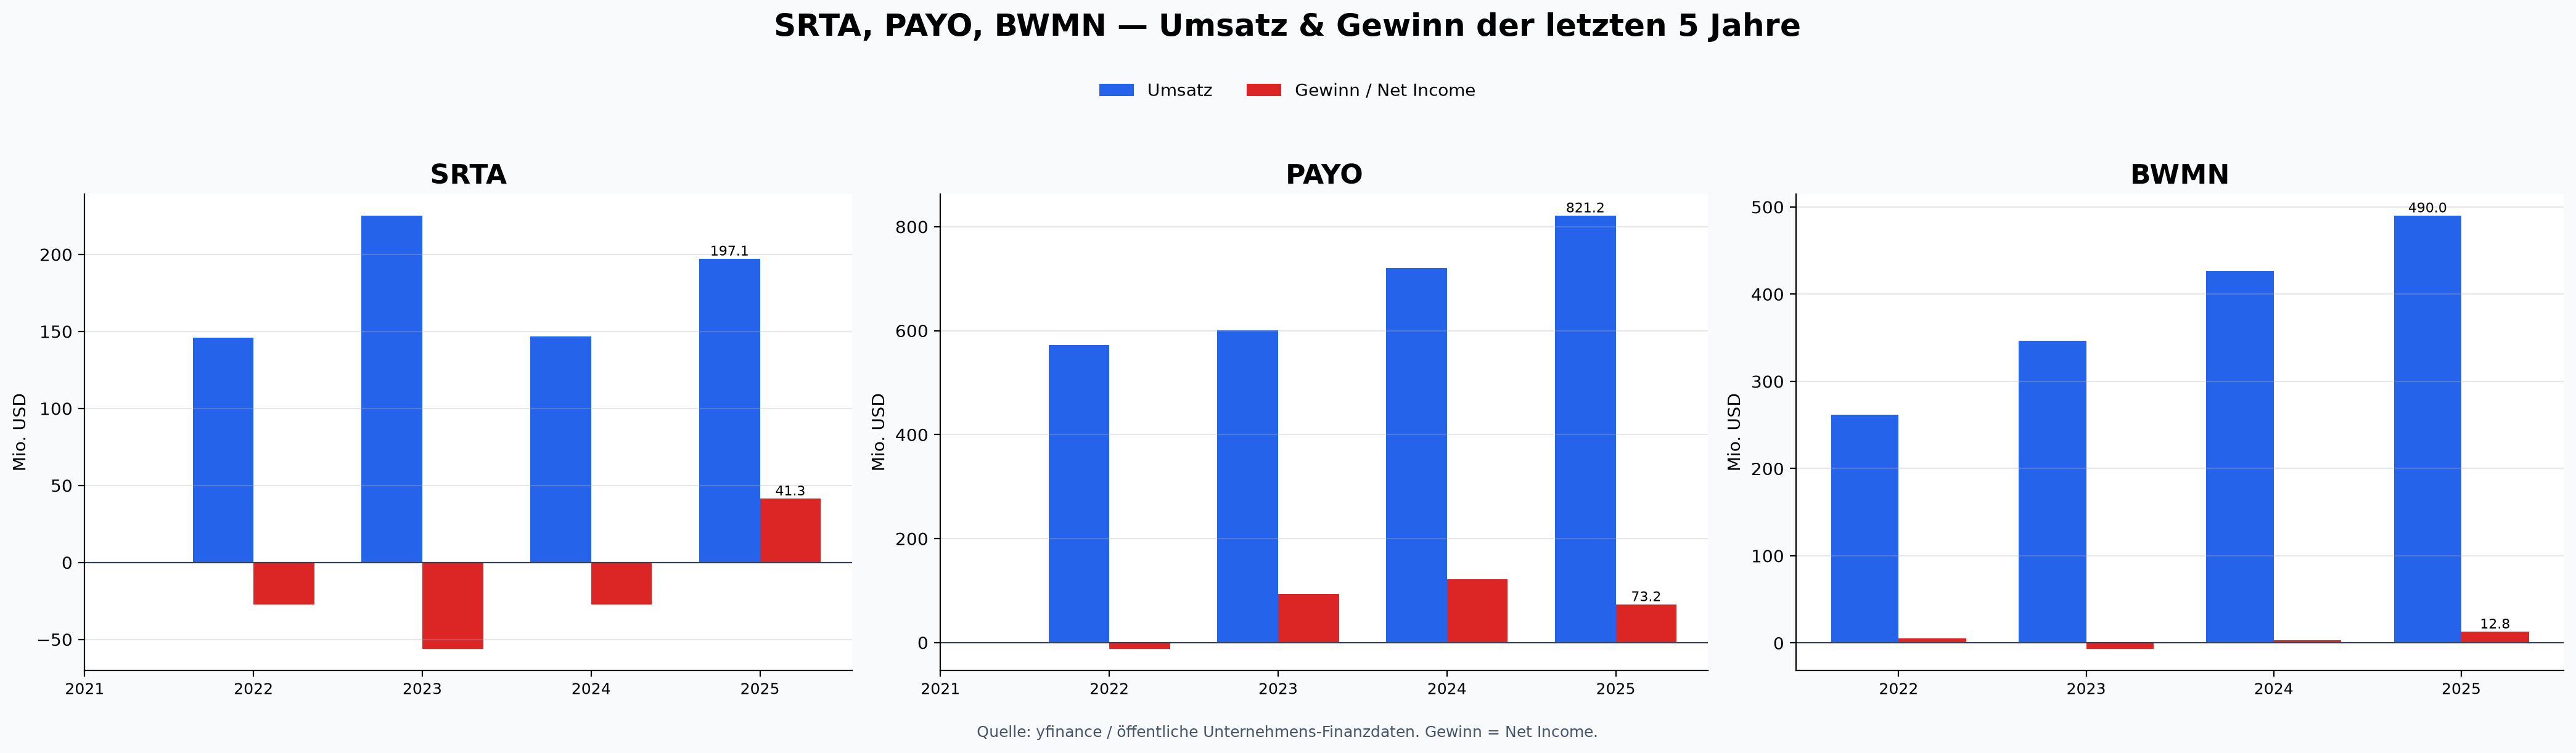
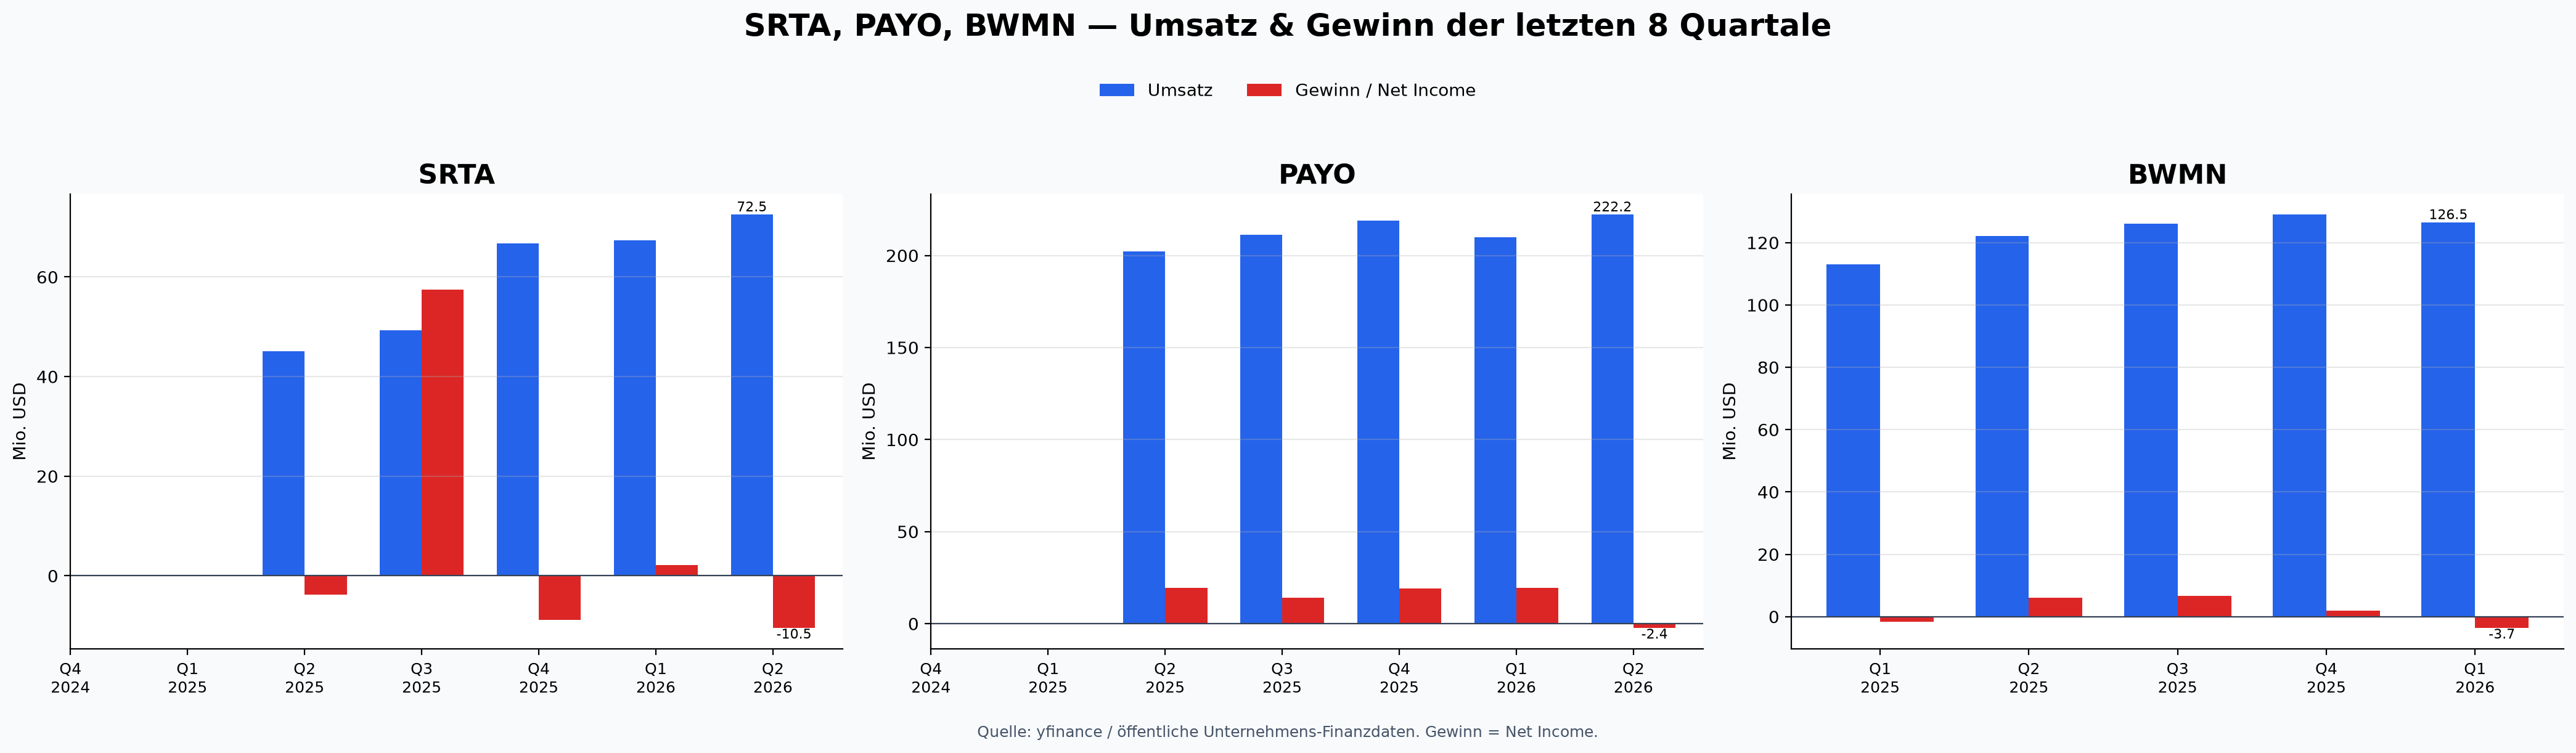
Approx. $509M market cap using yfinance last price $5.88 on 2026-06-21 and 86.5M shares outstanding from the Q1 2026 10-Q; Q1 2026 revenue $67.4M (+87.4% YoY), logistics revenue +32.4% organically, net income from continuing operations $2.4M, adjusted EBITDA $6.4M; FY2026 guidance $260M-$275M revenue, $29M-$33M adjusted EBITDA, $15M-$22M FCF before aircraft/engine acquisitions.
scale economies logistics clinical staffing compliancenetwork density effects opo transplant center coverageswitching costs workflows protocols trustprocess power dispatch recovery perfusion qualitycornered resource specialized staff logistics transplant trustcounter positioning one call medical platform vs fragmented vendors
Kill / sell rules
- Remove if FY2026 guidance is materially cut without a one-off explanation.
- Remove if two consecutive quarters show weak organic logistics growth plus no clinical margin improvement.
- Remove if free cash flow before aircraft/engine acquisitions fails to convert despite adjusted EBITDA.
- Remove if management resumes unfocused aviation/passenger optionality.
- Remove if acquisitions become large/dilutive/unintegrated or safety/regulatory failures damage trust.
Active Watchlist
PAYO
Payoneer Global Inc.
84score
Global SMB cross-border commerce infrastructure mispriced as a commodity/rate-sensitive fintech. Payoneer combines regulated local rails, marketplace relationships, multi-currency accounts, AP/AR, working capital, and payout workflows across 7,000+ corridors and nearly 2M active customers. If core volume reaccelerates and margins scale, it has a plausible 5-10 year path to multi-billion revenue and $15B+ equity value.
Approx. $1.8B equity value using Yahoo chart price around $4.96 and ~360M share count estimate; Q1 2026 revenue $261.6M, operating income $30.0M, net income $19.6M.
switching costsscale economiesbrandpartial network effectscornered resource regulatory local railsprocess power risk compliance localization
Kill / sell rules
- Remove if two consecutive quarters show deteriorating active customers plus sub-10% core revenue growth.
- Remove if compliance/fraud losses materially impair trust.
- Remove if management uses cash for dilutive or unfocused M&A.
- Remove if gross/transaction economics structurally compress.
- Remove if thesis depends mainly on interest income rather than durable payments volume.
Active Watchlist
BWMN
Bowman Consulting Group Ltd.
82score
Founder-led national infrastructure engineering/services consolidator in a fragmented AEC market. The market may price Bowman as a cyclical consultant, while the upside case is a Strata-like hidden workflow platform: local mission-critical relationships plus national scale, geospatial/automation tooling, public infrastructure tailwinds, and a bolt-on acquisition flywheel.
Approx. $0.55B equity value using Yahoo chart price around $33.32 and Q1 2026 weighted average shares of ~16.45M; Q1 2026 gross contract revenue $126.5M, net loss $3.7M, adjusted EBITDA $16.8M.
scale economiesswitching costs client project historyprocess power acquisition integration geospatial QAbrand emerginglimited network effects cross office referralscounter positioning mid sized local national model
Kill / sell rules
- Remove if leverage rises above a conservative service-business range without credible deleveraging path.
- Remove if two or more quarters show revenue growth driven mostly by acquisitions while margins/backlog deteriorate.
- Remove if cash conversion remains poor for a full year.
- Remove if Gary Bowman materially reduces involvement without proven succession.
- Remove if acquisitions become larger and strategically unfocused.
Watchlist High Risk Convex
SDGR
Schrödinger, Inc.
7.4score
Computational chemistry / molecular-design software platform with drug-discovery optionality; could become mission-critical R&D infrastructure if AI-enabled molecular simulation adoption broadens.
5–10x plausible but high risk if software/platform revenue scales to $500–700M+, margins become software-like, and pipeline/milestone economics add upside from a sub-$1B market cap.
987807936
Kill / sell rules
- software revenue stalls for multiple quarters
- annual cash burn accelerates without commercial traction
- cash runway below roughly two years
- management shifts too far toward self-funded biotech risk
- gross margin/platform retention deteriorates
Key risks
- weak or lumpy revenue growth
- high operating burn
- internal pipeline consuming too much capital
- AI drug-discovery hype compression
- software retention/gross margin deterioration
Active Watchlist
XMTR
Xometry, Inc.
86score
AI-native custom-manufacturing marketplace that could become the procurement and execution infrastructure layer for fragmented machine shops and enterprise buyers. If Xometry’s buyer/supplier network, instant quoting, enterprise workflows, and Siemens Xcelerator partnership create a durable digital thread from design to delivered parts, it has a plausible 5-10 year path to multi-billion revenue and a 5-10x equity outcome.
Approx. $5.0B market cap / $5.1B enterprise value at yfinance price ~$95.29; TTM revenue ~$740.8M; cash ~$224.0M; debt ~$339.8M. Q1 2026 revenue $205.1M (+36% YoY), marketplace revenue $191.3M (+40% YoY), net loss $5.3M, adjusted EBITDA $10.5M.
network effects two sided marketplacescale economies pricing sourcing dataswitching costs enterprise procurement workflowscounter positioning asset light marketplace vs brokers and capex heavy shopsprocess power ai quoting supplier matching fulfillmentbrand enterprise manufacturing
Kill / sell rules
- Remove if active buyer growth falls below low-teens for two consecutive quarters while revenue growth slows materially.
- Remove if marketplace gross margin reverses structurally or supplier quality/on-time delivery problems damage trust.
- Remove if adjusted EBITDA turns negative again without a clear high-ROI investment reason.
- Remove if Siemens/Xcelerator integration fails to produce observable enterprise demand or strategic validation over 12-24 months.
- Remove if dilution/debt-funded expansion outruns gross-profit growth or cash conversion.
Active Watchlist
VHI.TO / VHIBF
VitalHub Corp.
87score
Healthcare workflow software consolidator: EHR, patient flow, care coordination, clinical workflow, workforce and patient-engagement tools. The market may view VitalHub as a small Canadian healthcare-software roll-up, while the asymmetric thesis is a mission-critical healthcare operating layer with sticky regulated workflows, high gross margins, organic ARR growth, cross-sell, and disciplined tuck-in M&A across fragmented health systems.
Approx. CAD $446M market cap from StockAnalysis TSX:VHI snapshot on 2026-06-18/19; FY2024 revenue $68.6M, ARR $71.1M (+59% YoY), organic ARR growth 15%, gross margin 81%, adjusted EBITDA $17.8M / 26% margin.
switching costs healthcare workflow embeddingscale economies R&D compliance sales implementationprocess power vertical software M&A integrationbrand healthcare workflow reputationcornered resource domain specific clinical workflows
Kill / sell rules
- Remove if organic ARR growth falls below high-single-digits for two consecutive years without M&A offset.
- Remove if acquisition pace causes margin compression, integration failures, or debt/dilution that outruns ARR growth.
- Remove if gross margin or adjusted EBITDA margin deteriorates structurally.
- Remove if healthcare systems do not expand usage/cross-sell across modules.
Active Watchlist
LMB
Limbach Holdings, Inc.
85score
Mission-critical building-systems infrastructure platform for mechanical, electrical, plumbing, and controls systems. The market may treat LMB as a cyclical contractor; the better thesis is a higher-quality owner-direct service platform for healthcare, industrial, data-center, life-sciences, education, and other uptime-critical facilities, with recurring relationships, margin mix shift, local density and bolt-on consolidation optionality.
Approx. $0.95B-$1.0B market cap from June 2026 market-data references; FY2025 revenue $646.8M (+24.7% YoY), Owner Direct Relationships revenue $485.7M (+40.6%) and ~75% of total revenue, net income $39.1M, FY2026 guidance $730M-$760M revenue and $90M-$94M adjusted EBITDA with free cash flow expected around 75% of adjusted EBITDA.
switching costs facility relationships system history uptime trustprocess power owner direct MEPC execution and service modelscale economies procurement labor recruiting branch densitycounter positioning owner direct vs low margin general contractor workbrand mission critical building systems
Kill / sell rules
- Remove if ODR mix falls materially or GCR work regains dominance.
- Remove if adjusted EBITDA growth does not convert to free cash flow over a full year.
- Remove if acquisitions become large/unfocused or integration damages margins.
- Remove if backlog/organic growth weakens in core mission-critical verticals for multiple quarters.
Active Watchlist
IIIV
i3 Verticals, Inc.
84score
Focused GovTech/public-sector workflow software platform after divesting merchant services and healthcare RCM. The market may still view IIIV as a messy payments roll-up with slow headline growth; the asymmetric thesis is a mission-critical, regulated public-sector operating layer across courts/public safety, public administration/ERP, transportation, utilities, and education, with 5,000+ contracted customers, recurring revenue, embedded payments, sticky implementations, and a long fragmented modernization/M&A runway.
Approx. $416M public Class A market-cap snapshot from yfinance at $21.29 on 2026-06-28; economic equity value is higher if Class B/non-controlling units are included. Fiscal Q2 2026 revenue from continuing operations was $57.5M (+6.2% YoY), ARR was $183.5M (+11.6% YoY), net income from continuing operations was $2.2M, and adjusted EBITDA was $16.6M / 28.8% margin; FY2026 guidance after Q2 was narrowed/lowered, so reacceleration must be proven.
switching costs public sector implementations data workflows paymentsscale economies R&D security compliance support procurementprocess power vertical GovTech M&A and domain implementationcornered resource public sector domain relationships and procurement knowledgebrand trusted public sector software partnercounter positioning focused mid market GovTech suite vs point vendors and legacy systems
Kill / sell rules
- Remove if ARR growth falls below high-single-digits for two consecutive quarters without a clear transition explanation.
- Remove if SaaS/recurring revenue strength fails to translate into consolidated revenue reacceleration by FY2027.
- Remove if adjusted EBITDA margin drops below the low-20s due to integration problems or product sprawl.
- Remove if acquisition spending becomes dilutive/unfocused or debt outruns ARR and free-cash-flow growth.
- Remove if public-sector customer retention, implementation quality, or cybersecurity/compliance trust deteriorates.
Active Watchlist
EVI
EVI Industries, Inc.
83score
Small public buy-and-build platform for commercial and industrial laundry infrastructure: equipment distribution, facility design/planning, installation, parts, maintenance, repair, boiler/mechanical systems, water heating, power generation, and water-reuse systems. The market may price EVI as a low-margin equipment distributor, while the asymmetric thesis is a one-call mission-critical infrastructure and service platform for fragmented laundry/boiler workflows serving healthcare, hospitality, government, industrial, correctional, education, food/beverage, cruise and retail customers.
Approx. $207M market cap / $276M enterprise value from yfinance at $16.09 on 2026-07-05. Fiscal 2025 revenue was $389.8M (+10.3% YoY) and net income was $7.5M; latest reported quarter ended 2026-03-31 revenue was $101.1M and net income was $0.75M. Balance sheet leverage rose after acquisitions: yfinance snapshot showed about $73.0M debt and $4.3M cash, so margin/cash conversion must improve for the 10x case to work.
process power buy and build M&A integration and local operator networkscale economies supplier terms inventory parts technician densityswitching costs facility design installation service history and uptime trustcounter positioning decentralized local service platform vs single market distributorsbrand emerging national laundry infrastructure partnercornered resource technician network supplier relationships and installed base knowledge
Kill / sell rules
- Remove if organic growth remains low-single-digit while acquisition debt rises or share dilution accelerates.
- Remove if gross margin or operating margin does not improve after recent acquisitions are integrated.
- Remove if free cash flow fails to cover working-capital needs and acquisition-related debt service over a full year.
- Remove if management deviates from disciplined small tuck-ins into large/unrelated deals.
- Remove if supplier/customer relationships weaken, technician availability constrains service, or project delays turn backlog into poor cash conversion.
Active Watchlist
RDVT
Red Violet, Inc.
86score
Identity-intelligence and risk/compliance data platform hiding in a small-cap wrapper. Red Violet's idiCORE/IDI and FOREWARN products sit inside fraud prevention, identity verification/authentication, due diligence, legislative compliance, debt recovery, law-enforcement/government, real-estate safety, collections and corporate-security workflows. The market may price RDVT as an expensive niche data vendor; the asymmetric thesis is a high-gross-margin, cloud-native identity graph and workflow rail where more data, more customers, API/batch integrations and specialized compliance use cases compound into a mission-critical fraud/risk infrastructure platform.
Approx. $954M market cap / $913M enterprise value from yfinance at $67.59 on 2026-07-12. Q1 2026 revenue was $25.8M (+17% YoY), gross margin was 75%, adjusted gross margin 85%, net income $4.4M, adjusted EBITDA $10.7M / 41% margin, operating cash flow $6.6M, and cash/equivalents $43.5M. FY2025 revenue was $90.3M (+20%), gross profit $65.1M, net income $13.2M, and yfinance financials show FY2025 EBITDA about $23.8M.
scale economies data ingestion cloud AI compliance salesswitching costs API batch workflows investigative training and compliance recordsprocess power identity graph matching data quality and risk scoringcornered resource longitudinal identity graph and permissible use compliance knowhowbrand trust in fraud risk real estate safety and investigationsnetwork data effects more queries customers feedback and data sources improve utility
Kill / sell rules
- Remove if revenue growth falls below low-teens for two consecutive quarters without a clear macro/customer-budget explanation.
- Remove if adjusted EBITDA margin falls below 30% while revenue growth is also decelerating, indicating loss of operating leverage.
- Remove if data-privacy, permissible-use, FCRA/GLBA/DPPA, law-enforcement or real-estate safety trust issues materially impair customer adoption.
- Remove if IDI billable-customer growth or FOREWARN user/association growth stalls for multiple quarters.
- Remove if valuation remains rich while the company fails to expand beyond current identity/fraud/real-estate verticals into broader compliance and risk workflows.
Active Watchlist
TRAK
ReposiTrak, Inc.
84score
Food traceability and supplier-compliance rails hiding inside a tiny profitable SaaS/network company. ReposiTrak operates a hub-and-spoke B2B platform where retailers/wholesalers pull suppliers into compliance, traceability and supply-chain workflows. The market may punish flat near-term revenue and delayed FSMA 204 enforcement, while the upside case is that industry-led traceability requirements, recall readiness, supplier records, Touchless Traceability patents/processes and a growing food-supply network turn TRAK into a mission-critical compliance/traceability operating layer for fragmented grocery, wholesale, foodservice and supplier ecosystems.
Approx. $160M market cap / $134M enterprise value from yfinance at $8.81 on 2026-07-19; shares outstanding 18.17M per FY2026 Q3 10-Q. TTM revenue about $23.5M, gross margin about 85%, EBITDA margin about 35%, profit margin about 31%, cash about $26.4M and essentially no bank debt. FY2026 Q3 revenue was $5.88M (-1% YoY), operating income $2.25M (+24% YoY), net income $1.99M, and nine-month FY2026 revenue was $17.71M (+5%) with operating income $5.96M (+28%).
network effects hub spoke retailers wholesalers suppliers traceability recordsswitching costs supplier onboarding KDE CTE compliance workflows audit historyprocess power touchless traceability 500 point validation data ingestionscale economies SaaS compliance network sales support data validationcornered resource food traceability network supplier records and retail relationshipscounter positioning no hardware label or scanning disruption vs heavy ERP traceability projects
Kill / sell rules
- Remove if traceability/onboarding activity does not convert into double-digit recurring revenue growth by FY2027/FY2028.
- Remove if FDA FSMA 204 enforcement delay to July 2028 causes customers to pause adoption and industry-led requirements do not fill the gap.
- Remove if gross margin falls below 75% or operating margin falls below 20% while revenue is flat or declining.
- Remove if hubs stop pulling suppliers into the network, supplier-record growth stalls, or the hub-and-spoke network effect weakens.
- Remove if larger ERP/supply-chain vendors or retailers replicate Touchless Traceability with lower switching cost before TRAK reaches broader network density.
Key risks
- Revenue growth is currently only low-single-digit/flat despite high margins.
- FDA FSMA 204 enforcement has been pushed toward July 2028, which may slow urgency.
- Tiny revenue base and customer/hub concentration can make growth lumpy.
- Large ERP, EDI, supply-chain, distributor or retailer-owned systems could compete.
- Valuation can compress if TRAK remains a niche compliance tool rather than a broad network rail.
Active Watchlist
TCS.TO / TCYSF
Tecsys Inc.
85score
Mission-critical supply-chain execution software for healthcare and complex distribution hiding in a small Canadian public company. The market may view Tecsys as a slow, niche WMS/vendor-services company with modest GAAP profit; the asymmetric thesis is a sticky operating layer for hospital supply chains, pharmacies/health systems and complex distributors where inventory visibility, compliance, replenishment, warehouse execution and integration reliability matter. If Elite SaaS migration, healthcare penetration, AI-driven TecsysIQ workflows and Gartner-recognized WMS credibility compound, TCS can become a scarce healthcare/distribution supply-chain infrastructure platform.
Approx. CAD $477.6M market cap from StockAnalysis TSX:TCS snapshot as of 2026-07-24; yfinance showed 14.34M shares outstanding and recent TSX close around CAD $31.94-$33.09. FY2026 revenue was CAD $193.1M (+9.5% YoY), SaaS revenue CAD $80.4M (+20%), SaaS ARR CAD $86.8M (+13% / +15% constant currency), net profit CAD $4.0M, and adjusted EBITDA CAD $20.0M / 10% margin.
switching costs healthcare distribution supply chain workflows integrations trainingprocess power supply chain execution WMS healthcare domain and implementation knowhowscale economies SaaS R&D AI security support and implementationbrand trust mission critical healthcare and distribution supply chainscornered resource domain specific healthcare supply chain data workflows and customer relationshipscounter positioning vertical healthcare distribution execution vs horizontal ERP and generic WMS
Kill / sell rules
- Remove if Elite SaaS revenue growth falls below low-teens for two consecutive years without clear migration timing explanation.
- Remove if SaaS ARR growth stays below 10% while professional-services/hardware mix remains necessary to drive headline revenue.
- Remove if adjusted EBITDA margin fails to expand toward mid-teens as SaaS mix rises by FY2028.
- Remove if healthcare win rates/backlog weaken materially or government/health-system budget delays become structural.
- Remove if larger ERP/WMS vendors neutralize Tecsys' vertical differentiation or implementation quality/customer trust deteriorates.
Key risks
- Total revenue growth is only high-single-digit, so the 10x case depends on SaaS acceleration and margin expansion, not current consolidated growth.
- Healthcare and government-related buying cycles can delay implementations and make quarterly growth lumpy.
- Large ERP/WMS vendors, healthcare IT incumbents and supply-chain suites can compete aggressively.
- Professional-services implementation capacity may constrain growth or pressure margins.
- Small-cap Canada liquidity and valuation risk can amplify drawdowns if growth disappoints.
Active Watchlist
TRNS
Transcat, Inc.
84score
Mission-critical calibration, compliance, validation, reliability and test-equipment service platform for regulated life-sciences, medical-device, aerospace/defense, energy and industrial customers. The market may treat TRNS as a niche distributor/service company, while the asymmetric thesis is a one-call regulated metrology infrastructure consolidator with recurring calibration cycles, embedded customer-site labs, proprietary workflow systems, cross-sell from distribution/rentals, and a long fragmented M&A runway.
Approx. $799M market cap / $926M enterprise value from yfinance at $85.37 on 2026-08-02; company June 2026 profile showed $750M market cap at $80.32 on 2026-05-27. FY2026 revenue was $331.9M (+19.2% YoY), service revenue $217.2M (+19.7%), adjusted EBITDA $48.7M (+22.7%) and operating free cash flow $19.6M. Balance sheet leverage increased after Essco/SCM acquisitions: yfinance showed ~$133M total debt and $4.9M cash; company FY2026 release showed $99.9M debt, $94.9M net debt and 2.03x leverage at 2026-03-28.
switching costs regulated calibration records audits customer site labsscale economies lab network technician training accreditation distribution rentalsprocess power CalTrak C3 quality systems acquisition integration and metrology executionbrand Calibrated by Transcat quality compliance trustcornered resource ISO IEC 17025 scope technician network blue chip regulated customer relationshipscounter positioning one call calibration distribution rental platform vs local labs and OEM silos
Kill / sell rules
- Remove if service organic revenue falls below mid-single-digits for two consecutive years without a clear macro/transitory explanation.
- Remove if service gross margin fails to recover/expand after new customer wins and acquisition integrations mature.
- Remove if leverage remains above ~2.5x adjusted EBITDA or acquisitions become large, expensive, or outside the core calibration/compliance/rental flywheel.
- Remove if operating free cash flow fails to recover toward adjusted EBITDA conversion after working-capital/integration investments normalize.
- Remove if customer retention, ISO/accreditation quality, audit trust, technician capacity, or regulatory reputation deteriorates.
Key risks
- GAAP net income fell in FY2026 due to amortization, interest, transition and acquisition costs; the story depends on adjusted earnings converting to cash.
- Debt rose materially after acquisitions, reducing room for integration mistakes.
- Calibration remains technician- and utilization-dependent, not pure software; labor availability can cap growth and pressure margins.
- Service organic revenue was only 3% for FY2026 despite 7% in Q4, so sustained high-single-digit organic growth must be proven.
- M&A integration, accreditation failures, customer-site execution issues or quality lapses could damage the trust moat.
Active Watchlist
WLDN
Willdan Group, Inc.
85score
Mission-critical energy and grid-infrastructure operating platform hiding in a technical-services wrapper. Willdan combines utility program management, policy/advisory analytics, software/data models, engineering, public finance, building-energy efficiency, BESS/microgrids, substations and commercial energy procurement. The market may treat WLDN as a cyclical consulting/EPC contractor; the asymmetric thesis is a one-call planning-design-deliver platform for electricity-load growth, affordability, reliability, electrification and data-center power constraints across fragmented utility, municipal and commercial workflows.
Approx. $1.30B market cap / $1.36B enterprise value from yfinance at $86.24 on 2026-08-09; shares outstanding ~15.11M. FY2025 revenue was $681.6M, net income $52.6M and EBITDA $64.4M per yfinance/SEC-derived financials. Q2 2026 contract revenue was $231.0M (+33.2%), net revenue $117.2M (+23.5%), net income $24.3M (+57.7%) and adjusted EBITDA $33.0M (+50.6%); FY2026 targets were raised to $415M-$430M net revenue and $103M-$107M adjusted EBITDA.
switching costs utility programs customer data models measurement verification and regulatory trustprocess power plan design deliver energy program execution and MV analyticsscale economies engineering software policy data procurement and national program deliverycornered resource utility municipal relationships energy models and specialized engineering staffcounter positioning integrated advisory software engineering implementation vs point consultants and EPCsbrand trust in energy efficiency grid reliability and public sector programs
Kill / sell rules
- Remove if organic net-revenue growth falls below high-single-digits for two consecutive years while acquisitions are needed to hold the headline growth target.
- Remove if adjusted EBITDA margin retreats below ~20% of net revenue without a temporary project-mix explanation.
- Remove if large utility/municipal program wins do not convert into operating cash flow and free cash flow over a full year.
- Remove if Burton/APG/other acquisitions raise leverage or integration complexity without cross-sell and margin evidence.
- Remove if policy/regulatory changes or utility budget cycles materially weaken demand for energy-efficiency, grid-planning, BESS/microgrid or commercial energy services.
Key risks
- Some revenue is project/program and subcontractor-heavy, so headline contract revenue can overstate owned economics.
- Customer concentration and utility/municipal budget timing can make results lumpy.
- This is not pure software; labor, project execution, M&A integration and fixed-price work can pressure margins.
- The stock has already rerated after strong execution, so a 10x outcome needs sustained compounding beyond the current raised FY2026 guide.
- Policy incentives, energy-efficiency regulation, utility affordability politics or data-center interconnection cycles could change demand.
Active Watchlist
CODA
Coda Octopus Group, Inc.
84score
Tiny, profitable underwater-intelligence infrastructure company with patented real-time 3D/4D/5D/6D sonar, diver augmented-vision systems, digital underwater communications, and sole-source defense engineering relationships. The market may treat CODA as a lumpy microcap marine-equipment supplier; the asymmetric thesis is a scarce perception/compliance/safety rail for naval diving, UUV/ROV/underwater robotics, port security, subsea construction, salvage, offshore energy and mine-countermeasure workflows where zero-visibility real-time 3D perception is mission-critical.
A 5x path is plausible if CODA converts Navy DAVD approval, Echoscope PIPE/NANO adoption and defense-engineering relationships into $75M-$100M revenue while sustaining high gross margins. A 10x path is demanding but possible from roughly $119M market cap if real-time underwater perception becomes a standard sensor layer for UUVs, naval diving and subsea infrastructure: $150M-$250M revenue, 20%+ operating margins, strong cash conversion and a strategic defense/robotics multiple could support multi-billion-dollar equity value.
Approx. $119M market cap using Yahoo chart regular-market price $10.58 on 2026-08-14 and 11.276M shares outstanding from the fiscal Q2 2026 10-Q. FY2025 revenue was $26.6M, net income $4.1M and EBITDA $7.6M per the June 2026 corporate presentation. Fiscal H1 2026 revenue was $13.6M (+11.3% YoY), net income $2.63M (+44.3% YoY), EBITDA $4.38M, gross margin about 65.7%, and cash was $30.6M with minimal liabilities.
cornered resource patented real time 3D 4D 5D 6D sonar and DAVD IPprocess power underwater perception zero visibility visualization and defense qualificationswitching costs training integration mission workflows support and installed basebrand trust defense subsea ports and complex marine operationsscale economies R&D sensor platform support and manufacturing over larger volumecounter positioning single sensor real time 3D perception vs static multibeam or 2D sonar silos
Kill / sell rules
- Remove if DAVD U.S. Navy approval and European Navy engagement do not convert into material procurement/orders by FY2027.
- Remove if Echoscope PIPE/NANO trials in underwater vehicles/robotics fail to become repeat orders or program integrations.
- Remove if revenue remains stuck below roughly $35M-$40M for two fiscal years despite the claimed defense/UUV tailwinds.
- Remove if gross margin falls below 55% or operating margin below 10% without a temporary mix explanation.
- Remove if customer concentration, export/geopolitical restrictions, IP erosion, or quality failures impair defense/subsea trust.
Key risks
- Revenue is small and lumpy; fiscal Q2 2026 total revenue fell 1.6% YoY as Middle East/Asia marine projects paused.
- The 10x case depends on defense/UUV/DAVD procurement scaling, not just historical marine-project demand.
- Customer concentration and government procurement timing can distort quarterly results.
- Microcap liquidity, small sales force and execution capacity could limit institutional discovery and growth speed.
- Export controls, geopolitical sales exposure, defense qualification delays or sensor competition could slow adoption.
Active Watchlist
MITK
Mitek Systems, Inc.
84score
Digital identity, authentication, check-deposit and fraud-prevention infrastructure hiding inside a small profitable software company. The market may still treat MITK as a legacy mobile-check-capture vendor with uneven growth, while the asymmetric thesis is a high-assurance identity/fraud workflow rail embedded in banks, fintechs, telecoms and marketplaces. Mitek combines document/biometric identity, liveness, check image capture, check verification, and a growing Check Fraud Defender consortium network; if AI-driven fraud and real-time onboarding/authentication make these rails mission-critical, MITK can compound from a sub-$1B equity value into a much larger trust infrastructure platform.
A 5x path is plausible if MITK compounds revenue from the FY2026 guide near $200M toward $600M-$800M, keeps non-GAAP gross margins around 80%+, sustains 30%+ adjusted EBITDA margins, and earns a scarce fraud/identity infrastructure multiple. A 10x path is demanding but possible if the identity platform and Check Fraud Defender consortium become a default high-assurance network across financial institutions and regulated digital commerce: $1B+ revenue, strong FCF conversion, buybacks/net cash, and strategic scarcity could support multi-billion-dollar equity value.
Approx. $837M market cap using Mitek IR stock price $18.56 on 2026-08-21 and 45.12M shares outstanding from the FY2026 Q3 10-Q/companyfacts. Fiscal Q3 2026 revenue was $54.0M (+18% YoY), SaaS revenue $26.2M (+36% YoY), GAAP net income $8.4M, adjusted EBITDA $20.8M / 38.5% margin, LTM free cash flow $48.6M, and cash/investments $100.2M after retiring $155M convertibles. FY2026 guidance was raised to $195M-$200M revenue, Fraud & Identity revenue $105M-$109M, and adjusted EBITDA margin 32%-34%.
switching costs bank fintech onboarding authentication check deposit workflows integrationsnetwork effects check fraud defender consortium shared intelligenceprocess power document capture biometrics liveness fraud models and high assurance reviewcornered resource patents identity data check image history and bank trustscale economies AI models compliance security channel partners and SaaS infrastructurebrand trust in major banks regulated fraud and identity workflows
Kill / sell rules
- Remove if Fraud & Identity revenue growth falls below low-teens for two consecutive quarters without a one-off contract-transition explanation.
- Remove if SaaS revenue growth decelerates below 15% while check-verification growth remains only renewal/lump driven.
- Remove if Check Fraud Defender consortium adoption does not broaden beyond initial top-bank/partner proof points by FY2027.
- Remove if adjusted EBITDA margin falls below 25% or LTM free cash flow falls below $30M while revenue growth is slowing.
- Remove if identity/fraud accuracy, privacy, compliance, customer concentration, or AI/deepfake competition damages trust with major financial institutions.
Key risks
- Some of the historical business is mature check-deposit/check-verification technology, not pure hypergrowth identity SaaS.
- Revenue can be lumpy because large banks, renewals and license-to-SaaS transitions affect quarters.
- Fraud/identity competition is intense: Socure, CLEAR, LexisNexis, TransUnion, Experian, Persona, Onfido/Entrust, Jumio, banks' internal tools and big-cloud AI stacks.
- Deepfake/AI fraud can force high R&D and data costs; model errors or compliance/privacy failures could destroy trust.
- The 10x case requires network/identity-platform expansion; if Check Fraud Defender stays niche, MITK may remain a solid but smaller software business.
Active Watchlist
PDFS
PDF Solutions, Inc.
84score
Semiconductor manufacturing data, yield, and process-control infrastructure hiding inside a small-cap software/services wrapper. PDF Solutions sells Exensio analytics, Cimetrix factory connectivity, characterization vehicles, secureWISE data and analytics, and yield-ramp/process-control workflows into chipmakers, foundries, OSATs, equipment vendors and electronics manufacturers. The market may view PDFS as a cyclical semiconductor-services vendor; the asymmetric thesis is a mission-critical data operating layer for increasingly complex fabs where yield, ramp speed, traceability, equipment connectivity and AI/ML analytics become harder to replace as customers standardize workflows and data history around the platform.
A 5x path is plausible if PDFS compounds revenue from the current ~$240M run-rate toward $700M-$1B while keeping 70%+ gross margins, expanding non-GAAP operating margins toward 25%+, and proving that Exensio/Cimetrix/secureWISE are durable semiconductor data rails rather than project tools. A 10x path is demanding but possible from roughly $1.9B market cap if PDFS becomes a default factory/yield data platform across leading-edge, advanced packaging and high-volume electronics manufacturing: $1B+ revenue, strong FCF conversion, high recurring/backlog visibility and scarce semiconductor software infrastructure valuation could support multi-billion to low-teens-billion equity value.
Approx. $1.89B market cap using Nasdaq last sale $44.81 on 2026-08-27 and 42.227M shares outstanding from the Q2 2026 10-Q; approx. $1.84B enterprise value after $114.9M cash and $66.5M debt. Q2 2026 revenue was $61.5M (+19% YoY), GAAP gross margin 69%, GAAP net income $4.3M, non-GAAP net income $11.4M, recurring revenue 80%, and ending backlog $270.7M.
switching costs fab data history yield workflows equipment integrations and trainingprocess power semiconductor yield ramp characterization AI analytics and factory connectivitycornered resource Cimetrix Exensio secureWISE domain data IP and fab customer relationshipsscale economies R&D semiconductor domain support cloud data and global customer successbrand trust with chipmakers foundries OSATs equipment vendors and SEMI ecosystemcounter positioning independent cross fab data layer vs internal point tools and equipment silos
Kill / sell rules
- Remove if total revenue growth falls below high-single-digits for two consecutive years while backlog also stops growing.
- Remove if recurring revenue falls below roughly 70% or customers shift back toward one-time projects without platform expansion.
- Remove if GAAP gross margin falls below 60% or non-GAAP operating margin fails to move toward the 20%+ range as revenue scales.
- Remove if Exensio/Cimetrix/secureWISE adoption does not expand beyond point deployments into broader fab or enterprise workflows.
- Remove if leading foundries/IDMs, EDA vendors, equipment vendors or hyperscaler AI stacks commoditize PDFS' analytics/connectivity layer.
Key risks
- Semiconductor capex/yield-spending cycles can make bookings, gainshare and upfront revenue lumpy.
- The 10x case requires platform standardization; PDFS may remain a respected niche yield-services/software vendor instead.
- Large EDA/factory-automation/equipment vendors or internal fab data platforms can compete or bundle analytics.
- Recurring revenue includes categories such as Cimetrix runtime, secureWISE data and gainshare that can recur historically but are not all pure SaaS ARR.
- High valuation sensitivity after the stock's recovery; any margin/backlog disappointment can compress the multiple.